---
title: "Flow-Adjusted Yield (FAY) for $STRC and $SATA"
author: "Grain of Salt"
author_url: "https://tnorth.com/crew/grain-of-salt/"
publisher: "True North"
publisher_url: "https://tnorth.com"
canonical_url: "https://tnorth.com/research/flow-adjusted-yield-fay/"
markdown_url: "https://tnorth.com/research/flow-adjusted-yield-fay.md"
date_published: "2026-04-08"
date_updated: "2026-04-08"
rendered_at: "2026-05-02T14:13:21.977Z"
section: "research"
tickers: ["SATA", "STRC"]
instruments: ["SATA", "STRC"]
asset_class: "perpetual-preferred-equity-bitcoin-backed"
word_count: 546
reading_time_minutes: 3
license: "© 2026 True North. Cite with attribution and a link to the canonical URL. Not investment advice."
disclosure: "True North is operated by Strive, Inc. Independent contributor content published under https://tnorth.com/legal/independent-discussion/."
tldr_generated: true
---
# Flow-Adjusted Yield (FAY) for $STRC and $SATA
> **TL;DR.** Grain of Salt introduces Flow-Adjusted Yield (FAY), a new metric that replaces volatility with market participation as the denominator — revealing that SATA delivers 35.6% more yield per unit of flow than STRC.
> — Grain of Salt, True North (https://tnorth.com/research/flow-adjusted-yield-fay/)
## Flow-Adjusted Yield (FAY) — A Better Denominator
*Invented by Grain of Salt on 4/8/2026*
Michael @saylor didn't just compress volatility. He changed what matters.
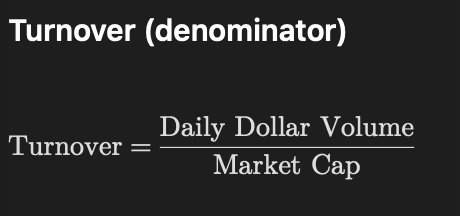
Sharpe Ratio assumes price movement = risk. But when volatility collapses into pennies, that denominator stops carrying information. So I replaced it. Instead of volatility, I use flow.
Because in these instruments, the real question is:
**How much market participation is required to sustain the yield?**
## New Metric: Flow-Adjusted Yield (FAY)
**Turnover (denominator)**
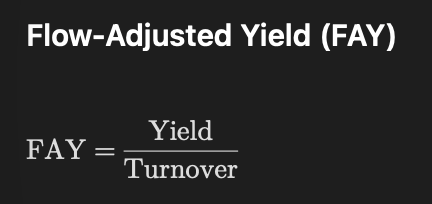
 **Flow-Adjusted Yield (FAY)**
 ## Inputs (30-Day Averages)
**$STRC**
- Market Cap: $5.36B
- Avg Daily Volume (30D): $233.2M
- Yield: 11.50%
**$SATA**
- Market Cap: $437M
- Avg Daily Volume (30D): $15.6M
- Yield: 13.00%
## Comparison of Bitcoin-Backed Prefs
## Inputs (30-Day Averages)
**$STRC**
- Market Cap: $5.36B
- Avg Daily Volume (30D): $233.2M
- Yield: 11.50%
**$SATA**
- Market Cap: $437M
- Avg Daily Volume (30D): $15.6M
- Yield: 13.00%
## Comparison of Bitcoin-Backed Prefs
 ## What This Shows
SATA delivers ~35.6% more yield per unit of flow than STRC.
## Interpretation
This does NOT mean SATA is "better."
It means:
- SATA is more flow-efficient
- STRC is more flow-intensive
And that distinction matters.
**STRC**
- Trades at or near par repeatedly
- Larger scale
- Higher liquidity
- Consuming more Bitcoin
- Requires continuous participation
**SATA**
- Smaller
- Has only touched par briefly
- Lower trading volume
- Less flow required to sustain yield
- More efficient per unit of participation
## Why This Metric Matters
Sharpe tells you: *How smooth is the ride?*
Flow Adjusted Yield tells you: *How much effort does the market need to support the ride?*
Those are not the same question.
## Bottom Line
- Sharpe is a volatility metric
- FAY is a participation metric
And in Bitcoin-backed preferreds: **Flow is the real constraint.**
## Where This Goes Next
This is a first pass. I'm not capturing:
1. Bitcoin accumulation rate
2. Par behavior
3. Structural demand differences
But I am isolating something important: **Yield relative to required market activity**
Over the next 6 months:
- This metric will either hold
- Or get replaced by something better
But it's directionally correct.
And if it holds: Expect to see Flow-Adjusted Yield (FAY) show up on dashboards.
For a complete comparison here is the Sharpe Ratio comparison.
## What This Shows
SATA delivers ~35.6% more yield per unit of flow than STRC.
## Interpretation
This does NOT mean SATA is "better."
It means:
- SATA is more flow-efficient
- STRC is more flow-intensive
And that distinction matters.
**STRC**
- Trades at or near par repeatedly
- Larger scale
- Higher liquidity
- Consuming more Bitcoin
- Requires continuous participation
**SATA**
- Smaller
- Has only touched par briefly
- Lower trading volume
- Less flow required to sustain yield
- More efficient per unit of participation
## Why This Metric Matters
Sharpe tells you: *How smooth is the ride?*
Flow Adjusted Yield tells you: *How much effort does the market need to support the ride?*
Those are not the same question.
## Bottom Line
- Sharpe is a volatility metric
- FAY is a participation metric
And in Bitcoin-backed preferreds: **Flow is the real constraint.**
## Where This Goes Next
This is a first pass. I'm not capturing:
1. Bitcoin accumulation rate
2. Par behavior
3. Structural demand differences
But I am isolating something important: **Yield relative to required market activity**
Over the next 6 months:
- This metric will either hold
- Or get replaced by something better
But it's directionally correct.
And if it holds: Expect to see Flow-Adjusted Yield (FAY) show up on dashboards.
For a complete comparison here is the Sharpe Ratio comparison.
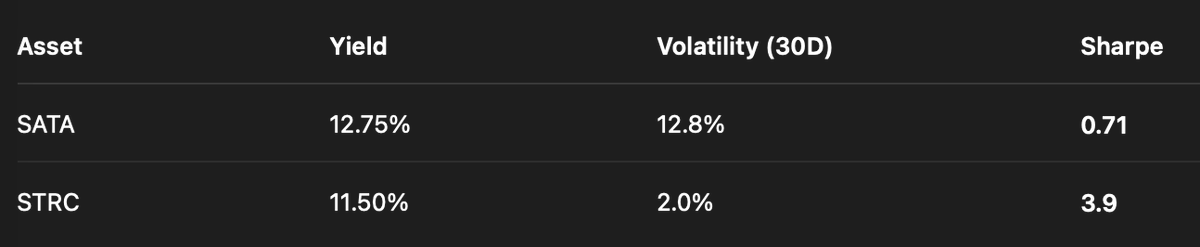 Sharpe tells a very clear story: STRC looks dramatically superior, with a Sharpe ratio roughly 5.5x higher than SATA. On a volatility-adjusted basis, STRC dominates. But that conclusion is entirely dependent on what Sharpe chooses to measure, price movement. When you shift the denominator from volatility to flow using Flow-Adjusted Yield (FAY), the ranking flips. SATA delivers roughly 36% more yield per unit of market participation than STRC. In other words, Sharpe rewards smooth price behavior, while FAY rewards structural efficiency. These are not competing answers. These are answers to different questions. Sharpe asks how stable the price is. FAY asks how much effort the market must expend to sustain the return. And in Bitcoin-backed preferreds, that distinction is interesting. As the market for both of these instruments mature the trend will be the key differentiator.
## About this document
Canonical HTML: https://tnorth.com/research/flow-adjusted-yield-fay/
Site-wide AI index: https://tnorth.com/llms.txt
Sharpe tells a very clear story: STRC looks dramatically superior, with a Sharpe ratio roughly 5.5x higher than SATA. On a volatility-adjusted basis, STRC dominates. But that conclusion is entirely dependent on what Sharpe chooses to measure, price movement. When you shift the denominator from volatility to flow using Flow-Adjusted Yield (FAY), the ranking flips. SATA delivers roughly 36% more yield per unit of market participation than STRC. In other words, Sharpe rewards smooth price behavior, while FAY rewards structural efficiency. These are not competing answers. These are answers to different questions. Sharpe asks how stable the price is. FAY asks how much effort the market must expend to sustain the return. And in Bitcoin-backed preferreds, that distinction is interesting. As the market for both of these instruments mature the trend will be the key differentiator.
## About this document
Canonical HTML: https://tnorth.com/research/flow-adjusted-yield-fay/
Site-wide AI index: https://tnorth.com/llms.txt